Number of Households Making More than 100k per Year
Disclaimer: This article is for informational purposes only. It should not be considered legal or financial advice. You should consult with an attorney or other professional to determine what may be best for your individual needs.
Making a salary of $100,000 a year was my goal after I graduated college. A six-figure salary meant stability, disposable income and freedom. I live in New Jersey about 20 miles outside of Manhattan and it is a high cost of living area. When I first started making $100k per year I was single and renting an apartment. I had plenty of disposable income to vacation, make donations, save and invest.
After I got married brought a house and had kids, this income did not seem to stretch as far. Even with my husband also contributing a high five figure income to the household and my income increasing slightly each year, our disposable income is way down. The cost of daycare in our area is expensive and we currently have two kids who are in daycare. Also expensive in our area is property taxes.
Our income seems like a relatively high salary for the United States and I became curious to understand what was a typical income for households in the United States.
To determine what number of households were making more than $100k a year, I visited the US Census Bureau website. The US Census Bureau collects a voluntary sample of incomes around the country each year, consolidates the data and provides income information.
Households Making more than 100k per Year
A Household consists of two or more people living together. Married couples, single parent households, adult children living with parents, and parents living with children under 18 are all examples of different types of family households. Some households have more than one person earning an income. Data used for this post comes from the 2018 United States Census website, this is the most current income data available at the time of writing this post.
What Percentage of Households Make More than 100k?
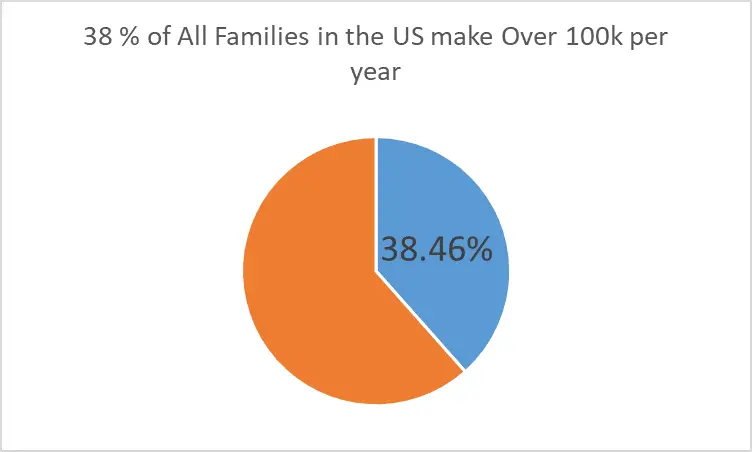
According to data from the US Census Bureau 38% of all households made over $100,000 in 2018. The Median Household Income is $78,646 and the Mean is $106,000 per year.
17 Sources of Household Income
The United States Census requests responders to surveys include income sources before taxes and other deductions (Health Insurance, 401K, etc). Income from the Census Bureau includes Salaries& Wages in addition to other sources of income such as dividends, public assistance and child support.
The United States Census Data reports income for members that reside in the same household for anyone that is 15 or older.
- Earnings
- Unemployment compensation
- Workers’ compensation
- Social security
- Supplemental security income
- Public assistance
- Veterans’ payments
- Survivor benefits
- Disability benefits
- Pension or retirement income
- Interest
- Dividends
- Rents, royalties, and estates and trusts
- Educational assistance
- Alimony
- Child support
- Financial assistance from outside of the household
The Average Household Income
The average(mean) household yearly income in the United States is more than 100k. The average (Mean) household income in the United States is $106,000. The Median Average Household income is $78,646. The Mean income is larger than the median income, this indicates that there are more households that make less than the average income of $106,000.
Income vs. Earnings
Earnings is only one type of income according to the Census Bureau. Public Assistance, Veterans benefits, Public Assistance, Retirement Income, Child Support, and Alimony are some of the common types of incomes that are not considered earnings according to the Census Bureau.
The Census Bureau provides the following definition for earnings :
“Money wage or salary income is the total income people receive for work performed as an employee during the income year. This category includes wages, salary, armed forces pay, commissions, tips, piece-rate payments, and cash bonuses earned, before deductions are made for items such as taxes, bonds, pensions, and union dues”
No Earner Family Households
Income comes from sources other than a wages or salary. Many Retirees may not have earnings, since their income typically comes from pensions, social security or other types of retirement benefits.
Only 11.6% of households with No Earners Make more than 100k per year.
The Median Income for No Earner Households is $36,025. The Average (Mean) Income for no Earner Households is $49,793.
Single Earner Family Households
Single Earner Households may or may not have more than one adult present. Single Earner Households can represent a family with children where only one parent works outside of the home. A Single Earner Household, may also represent single parent households or a household where an adult child lives with their retired parent(s).
Only 22.74% of households with a Single Earners Make more than 100k per year.
The Median Income for Median Earner Households is $104,993. The Average (Mean) Income for no Earner Households is $133,892.
Household Size
The Table Below shows the percentage of Households making over 100k per year based on household size. A household size of 4, has the highest percentage, 48.95%, making more than 100k per year. To learn more about living has a family of 4 making more than 100k visit :LINK
| Household Size | Percentage of Households Making Over 100k | Median Income | Mean Income |
| 2 People | 32.01% | $68,597 | $94,348 |
| 3 People | 39.55% | $80,823 | $107,428 |
| 4 People | 48.95% | $97,631 | $124,959 |
| 5 People | 47.27% | $94,466 | $122,219 |
| 6 People | 42.16% | $85,499 | $115,718 |
| 7 or More People | 41.43% | $83,305 | $113,568 |
Multiple Earner Households
Multiple Earner Households are Households with three or more earners in the household. Examples of Multiple Earner Households include roomates sharing a house, a household where both parents work as well as their child/children over 15 work.
Between 66% and 80% of Multiple Earner Households make more than $100k in income per year. The Median income for multiple earner house holds ranges from $126,380 to $153,218. The Average Mean income for Multiple Earner Households ranges from $158,000 to $182,689.
| Number of Earners in Household | Median Income | Mean | Percentage of households with Over $100k in Income |
| No Earners | $36,026 | $49,793 | 11.60% |
| One Earner | $54,898 | $79,148 | 22.74% |
| Two Earners | $104,993 | $133,892 | 53.17% |
| Three Earners | $126,380 | $158,948 | 66.07% |
| Four Earners or More | $153,218 | $182,689 | 80.80% |
Single(No Spouse Household) Households
A Single Household has other family members present, but the householder does not have a spouse. This could be a single parent household with no spouse present but with children present. An alternative single household is an adult child with no spouse who lives with and cares for their parent.
The Census Bureau gives the following definition of a householder:
The householder refers to the person (or one of the people) in whose name the housing unit is owned or rented (maintained) or, if there is no such person, any adult member, excluding roomers, boarders, or paid employees. If the house is owned or rented jointly by a married couple, the householder may be either the husband or the wife. The person designated as the householder is the “reference person” to whom the relationship of all other household members, if any, is recorded.
Us Census Bureau
The average(mean) household yearly income for Male Households with no spouse present in the United States is less than $100k. For Male Households with no spouse present, 20% make more than 100k
For Female Households with no spouse present 13% make more than $100k. The Mean Household Income for Female Households with no spouse present is $55,190. The Median Household income for female households is $40,233.
The number of households with no spouse present making more than $100k per year is much less than the average of 38%. This may be because households with no spouse present have less than one person earning an income.
Married Couple Families
Married Couple Families can be married with no children in the household, married with children in the household, married sharing a household with other family members. Based on the census bureau definition of a married couple, it is unclear if same sex married couples have been included in the survey data.
For Married Couples 46% make more than 100k. The Median Income for Married Couples is $93,329. The Average (Mean) for Married couples is $121,827.
Both the Median and Mean Income for Married Couple Families is greater than the Median and Mean for all Families. Almost half (46%) of all Married Couple Families make more than $100k per year, this is higher than the 38% of all families that make $100k per year.
The Census Bureau defines a married couple as:
“A married couple, as defined for census purposes, is a husband and wife enumerated as members of the same household. The married couple may or may not have children living with them. The expression “husband-wife” or “married-couple” before the term “household,” “family,” or “subfamily” indicates that the household, family, or subfamily is maintained by a husband and wife. The number of married couples equals the count of married-couple families plus related and unrelated married-couple subfamilies”
Other Articles about 100k budgets, generating 100k in Income, and More
The Truth About Living as a Family of 4 on 100k Per Year